
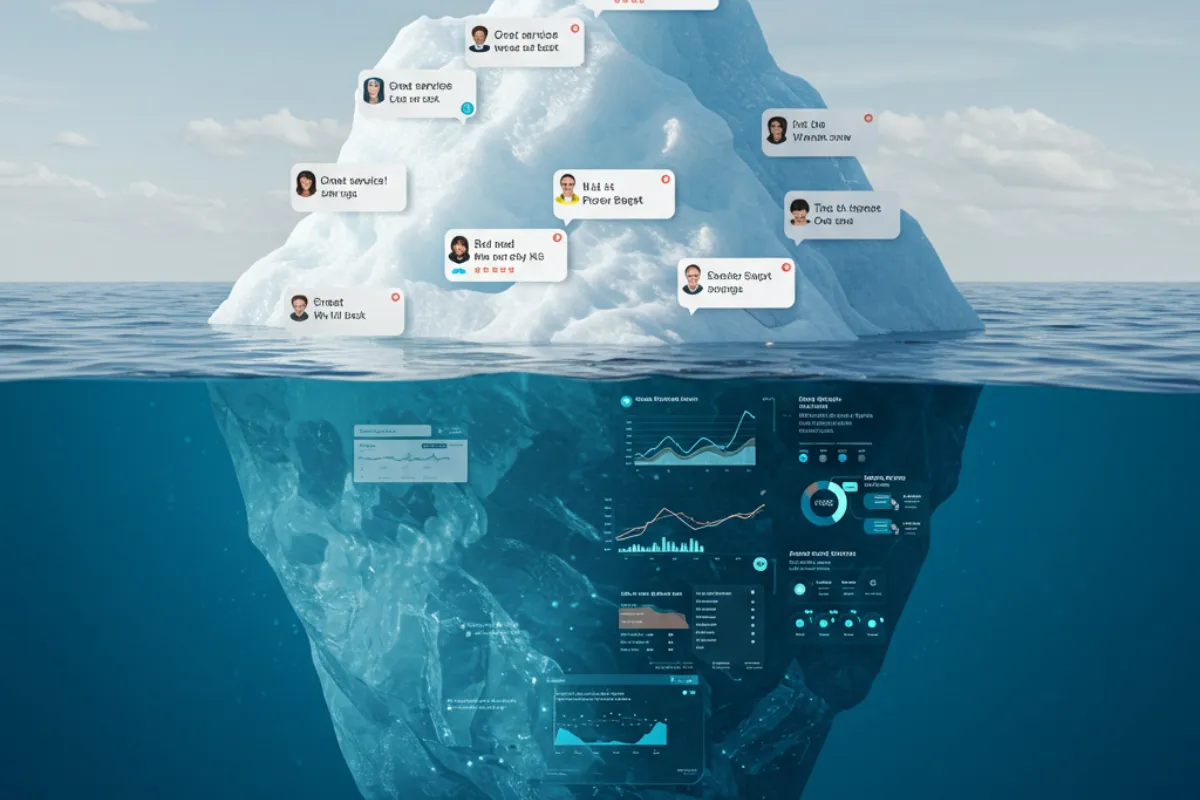
Misconception: The Loudest Customer Feedback Tells You What to Fix First
Learn why loud customer feedback can mislead decisions. Use voice of the customer data to spot real patterns and fix what matters most.
July 23, 2026
Misconception: "I already know my biggest customer problem because people keep mentioning it."
Reality: You remember what is loud, recent, and emotional. That is not the same thing as what happens most often.
Business owners are usually closer to customers than anyone else. That is a strength. It also creates a blind spot.
If you run a small business, you probably remember the angry phone call from last Tuesday, the glowing five star review from a longtime customer, and the awkward conversation at the front desk when someone said service felt slow. Those moments stick. Of course they do. They are emotional, immediate, and hard to ignore.
But memory is not analysis.
A handful of customer comments can tell you what happened to a few people. They cannot reliably tell you what is happening across the business. That gap matters more than most owners realize, because many operational decisions get made inside it.
This is where data analytics becomes useful in a very practical way. Not abstract. Not corporate. Just useful. When you analyze customer feedback at scale, patterns show up that are easy to miss when you read reviews one by one or rely on your gut. That is the heart of Voice of the Customer work. It turns scattered feedback into something you can actually use for decision making.
Why your brain overweights the memorable stuff
Owners are not irrational. They are human.
Most people naturally give more weight to comments that are:
recent
emotional
repeated in person
attached to a big spender or loyal customer
painful to hear
That makes sense on a personal level. It is a shaky way to run operational analytics.
Let’s say three customers complain this month that your online booking form is confusing. That might feel like the top issue. You heard it directly. It interrupted your day. One customer was especially upset. Now compare that with thirty smaller complaints spread across review sites over the past year about long wait times on Friday evenings. Each one, on its own, looks minor. Together, they point to a recurring service problem.
The difference is simple. Individual feedback creates stories. Aggregated feedback creates evidence.
A lot of small businesses in the United States operate on anecdotes without realizing it. That is not because owners do not care about business intelligence. It is because the signals are buried in normal business noise. Reviews live on different platforms. Comments come through email, texts, surveys, calls, and face to face conversations. Over time, it becomes almost impossible to spot patterns without some kind of customer analytics process.
A few complaints can be true, and still be misleading
This is the part people sometimes resist.
When someone complains, the complaint may be completely valid. The issue happened. The customer felt it. It matters. But validity is not the same as frequency, and frequency is not the same as priority.
You can have a real problem that affects five customers a year and a different problem that affects fifty customers a month. If you focus on the first one just because it was louder, you may spend time fixing the wrong thing first.
That is why business reporting should separate three questions:
What happened?
How often does it happen?
When, where, and under what conditions does it happen?
Without all three, decisions get fuzzy fast.
A review that says, "Service was slow," tells you what happened for one person. It does not tell you whether slow service is rare or routine. It does not tell you whether it happens on weekends, during lunch rushes, after staff changeovers, or only when one location is short staffed. That is where data insights start doing real work.
What review analysis reveals that casual reading misses
Imagine a local business has received 420 Google reviews over an 18 month period.
The owner remembers five recent complaints very clearly. Two were about a rude employee. One was about pricing. Two were about slow service. Based on memory alone, the owner concludes the main problem is staff attitude, with pricing as a close second.
That is a perfectly understandable conclusion. It is also incomplete.
Now imagine those 420 reviews are analyzed systematically. Each review is tagged for topic, sentiment, date, day of week, and time period mentioned when available. Instead of just reading comments one at a time, the business looks for recurring patterns across the full set.
Here is what shows up:
Mentions of slow service appear in 18 percent of negative reviews.
Mentions of pricing appear in 7 percent.
Mentions of rude staff appear in 5 percent.
Slow service complaints cluster heavily on Friday evenings between 5 p.m. and 8 p.m.
Positive reviews outside that time window often praise staff friendliness and quality.
That changes the conversation.
The business does not have a broad staff attitude problem. It has a timing and capacity problem. Customers are not reacting to employees in general. They are reacting to what happens during one predictable operating window.
That is the kind of insight you rarely get from reading reviews casually. You need a bit of structure, some customer analytics, and the willingness to quantify what customers are actually saying.
The Friday evening problem is a perfect example
Slow service every Friday evening is exactly the type of issue that hides in plain sight.
Why? Because no single review says, "Your system breaks down specifically on Friday evenings because demand exceeds staffing and handoff times slow down." Customers do not write like analysts. They write about their experience.
One review says the wait was too long. Another says service was great, but they waited forever for the check. Another says the team seemed overwhelmed. Another says they loved the business, but Friday nights feel chaotic.
Read separately, those comments feel random. Read together, they describe an operational pattern.
This is where operational analytics becomes more than a buzzword. It helps connect customer sentiment to business conditions. If slow service clusters on Friday evenings, that points to questions worth testing:
Are schedules too thin at peak hours?
Are newer staff being assigned to the busiest shifts?
Does the handoff between front of house and back of house slow down after 6 p.m.?
Are online orders and walk-in traffic colliding at the same time?
Is there a payment or checkout bottleneck?
Now the business has something concrete to investigate. That is much better than telling staff to "do better" based on a vague impression.
Voice of the Customer analysis is less glamorous than people think, and more useful
Voice of the Customer analysis sounds fancy. In practice, it is pretty grounded.
It means collecting customer feedback from the places it already exists, then analyzing it for patterns. Reviews, surveys, support tickets, email comments, chat logs, social mentions, call notes, complaint forms. Most businesses already have more usable feedback than they realize.
The value comes from turning all of that text into something measurable.
A solid Voice of the Customer process usually answers questions like:
What topics come up most often?
Which topics are tied to positive sentiment, and which ones drive negative sentiment?
Are complaints increasing, decreasing, or staying steady?
Do issues cluster by time, location, team, product, or service type?
Which problems seem annoying but minor, and which ones hurt the customer experience repeatedly?
That is business intelligence in a form owners can act on.
Instead of saying, "I feel like customers have been more impatient lately," you can say, "Negative feedback about wait times increased 22 percent over the last two quarters, and most of it came from Friday evenings." One is a hunch. The other is a starting point for better decision making.
Why this matters more for small businesses than for bigger companies
Large companies can survive some guesswork. They have more staff, more systems, and usually more margin for operational waste.
Small businesses do not have that luxury.
If you run a lean team, every fix competes for time, money, and attention. Training takes time. Schedule changes affect payroll. Process updates can disrupt the week. That means the order in which you solve problems matters a lot.
Small business analytics is often about prioritization, not perfection.
You do not need to measure everything. You do need to know whether the issue you are fixing is actually the issue that occurs most often or causes the most damage.
That is why even simple data consulting work around reviews and feedback can have outsized value. It helps small teams stop reacting to the noisiest signal and start responding to the most meaningful one.
Sometimes that work is handled in house. Sometimes a business brings in analytics consulting support or a fractional analyst for a short project. The structure matters less than the discipline. The real shift is moving from impression to evidence.
What useful feedback analysis actually looks like
A lot of people hear "analyze reviews" and picture a giant technical project. Usually it is more straightforward than that.
At a practical level, the process looks something like this:
Gather feedback from the main sources you already use.
Organize it by date, channel, rating, and theme.
Tag recurring topics such as speed, quality, communication, pricing, or staff behavior.
Measure how often each topic appears, and whether it shows up in positive or negative comments.
Look for patterns across time, location, service type, or team.
Tie those patterns to operational changes you can test.
That is it. Messy in practice, yes. But not mysterious.
The important point is that reading feedback is not the same as analyzing it. A business owner can read every review and still miss the trend if there is no structure around it. Structured business reporting makes the pattern visible.
The real goal is not to count complaints, it is to choose better fixes
This part gets overlooked.
The purpose of customer analytics is not to produce a prettier chart or a monthly summary nobody uses. The point is to improve decisions.
If review analysis shows your worst pain point is a Friday evening service slowdown, the next question is not "How do we reply to those reviews better?" The next question is "What change will reduce that pattern?"
Maybe it is one more person during the rush. Maybe it is a different shift start time. Maybe it is a tighter ordering process. Maybe it is simplifying the menu or reducing the number of steps at checkout. Maybe it is telling customers accurate wait times sooner.
The answer depends on the business. What matters is that the problem is now defined well enough to test solutions.
That is what good data insights do. They narrow the field. They help you spend limited energy where it counts.
A few cautions, because review data is useful but not perfect
I like review analysis a lot. I also think people can over-romanticize it.
Reviews are not a complete record of reality. Some customers never leave them. Certain experiences are more likely to trigger a review than others. Happy regulars may stay quiet for months, while one frustrated guest writes instantly. There is bias in the data.
Still, biased data can be useful if you understand what it is good for.
Reviews are excellent for spotting recurring themes, changes in sentiment, and moments where operations break down in ways customers notice. They are less reliable as a full measure of customer satisfaction on their own.
That is why the strongest business intelligence often combines review analysis with other sources, like survey responses, refund reasons, appointment cancellations, support messages, or internal performance data. When multiple sources point to the same issue, confidence goes up.
If Google reviews say Friday evenings feel slow, and your transaction timestamps show longer service times in that window, and staff schedules show thinner coverage then you are no longer guessing. You are seeing the same pattern from several angles.
If you already have customer feedback, you already have the raw material
Many owners think they need better software before they can do better analysis. Sometimes they do. Often they do not.
In a lot of cases, the raw material is already there. The missing piece is a process for turning it into usable information.
That might mean a simple spreadsheet and some careful tagging. It might mean building a more formal customer analytics workflow. It might mean bringing in data consulting help for a defined project. Different businesses need different levels of support.
But the first mental shift is the same for everyone.
Stop asking, "What feedback do I remember most?"
Start asking, "What patterns show up when I look across all the feedback I already have?"
That question is more boring. It is also more reliable.
The better question for any owner
Most business owners are not short on opinions. Usually they are short on clean signals.
When the loudest complaint lands in your inbox, it deserves attention. When the biggest compliment arrives, enjoy it. Both are part of the job. Just do not mistake either one for a trend.
Anecdotes tell you what felt important in the moment. Data analytics helps you see what keeps happening. Voice of the Customer analysis gives those patterns shape. Business intelligence turns them into priorities. And better priorities lead to better decisions.
So here is the question worth sitting with:
Are you fixing the problems you remember most, or the ones your data keeps repeating?
Curious what your data could tell you?
Let's talk it through on a short discovery call.
Book a discovery call